A concept map is a visual representation of the relationship between ideas. On a piece of paper (or using concept mapping software, such as Inspiration®*), draw a concept map that answers the question:
What are the processes of science? |
 |
|
|
|
|
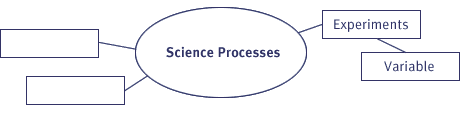
To build a concept map:
1. | Put "Science Processes" in a circle in the center of the map you build. |
2. | Now write any concepts related to "Science Processes" in boxes surrounding the central idea. For example, write "Experiments." |
3. | Continue to add any sub-concepts connected to the main idea or the subordinate ideas. For example, write "Variable" in a box (or other symbol) near "Experiments." |
4. | Draw lines or arrows to show the relationship between ideas. For example, draw a line that connects "Experiments" with "Science Processes." |
5. | Save your concept map for later use. |
|
|
|
Check out this Sample Concept Map to view an example of a completed map.
|
|
*To learn more about how to build a concept map and for ideas on how to use concept maps in your teaching, see these Web sites:
Visual Learning Using Inspiration
Mindjet Visual Thinking
IHMC Concept Mapping Software (free for non-commercial use)
Microsoft Visio
Note: All external links will open in a new browser window. Close that window when you are finished to return back to this course.
|