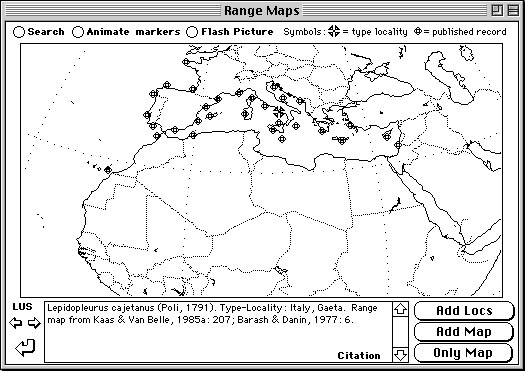

Example of card from "Range Maps" stack, depicting one of provided maps
with the "type-locality" and
"published record" markers (actually HyperCard buttons) dynamically
positioned on the map. Likewise,
information about the plotted species is provided in the data field.
If this species happened to have had
a broader distribution than could have been accommodated on a single
provided map, then two or more
range maps could have been entered, and in such cases the "Only Map"
button would have indicated
"Next Map" instead. The "Add Locs" and "Add Map" buttons provide an
intuitive interface for adding
(or deleting) existing locality markers, coupled with updating information
in the citation field. All this
data is stored on the main species card (Chiton Curator) as map numbers,
coordinates, or citation text,
so that map images do not need to be stored as disk-space-consuming
image files. Plans for the future
include replacing the current "1980's" vintage maps with higher resolution
maps, and providing for
automatic plotting with latitude/longitude coordinates. The range maps
are actually "smart" with
respect to adjustable biogeographic province boundaries. One can compile
a presence/absence matrix
of all species for all range maps for all defined biogeographic provinces
(for all range records or
type localities only). This provides a very powerful means to maintain
distributional records for
subsequent biogeographical analysis. Although the output spreadsheet
matrix is listed by species,
it is easy to employ spreadsheet formulas to convert these to tallies
for each higher-level taxon the
species is a member of. This approach has been used to create the "Province
Tallies" stack. When
new data is entered, a new report can be generated relatively painlessly.
Return to Chiton Card Page
Return to Worldwide Chitons Home Page
This Web page and its contents © D. J. Eernisse, 2001. Created 6/5/01, last modified 6/5/01.