Experiment 2 Results:
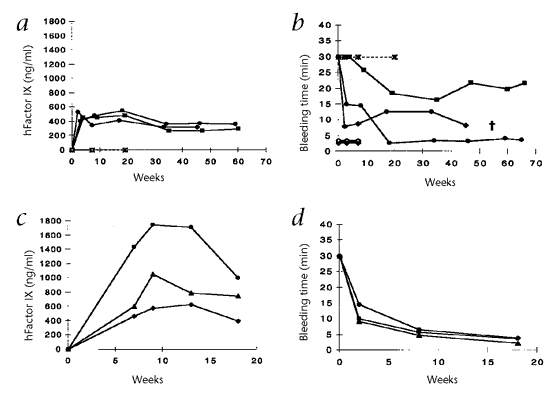
Two study groups of mice were given different dosages of the rAAV-hFIX. These mice were given the infusion through their portal vein or by tail vein administration. Graphs a. and b. represent a dosage of 4.2 x 10x. Graphs c. and d. represent a single dosage of 6.3 x 10x.
Graphs a. and c. represent the results of the ELISA assays and are a determination of the hFIX protein concentration present in the mice at the weeks shown. The bleeding times are depicted for both study groups in graphs b. and d. Each line on the graphs represents a different mouse in the study as follows, asterisks represent hemophilia B mice with rAAV-MFG-TH, and diamonds represents a non-transduced, non-factor IX deficient mouse. The squares represent a mouse given a tail vein infusion of the rAAV-hFIX vector. The circles and triangles represent the mice transfected with the hFIX vector through the portal vein.
![]()
How do the ELISA results compare to levels reported in normal transduced mice?
The normal mice and hemophilia mice show similar levels ranging from 250ng/ml to 1,800ng/ml.
What is the significance of transfecting normal mice with hFIX?
Transfecting normal mice with hFIX, gives a standard of comparison if there is some kind of threshold level or if the hFIX levels would be considerably higher in the transduced, normal mice.
Were the investigators successful in improving the bleeding times of the hemophilia B mice?
To view the interpretation of this experiment, click here
![]()