 Return to Biology 325 Home Page
Copyright © 2000-2004 D.J. Eernisse. All Rights Reserved.
Cladogram Terminology: Start with some basic definitions of terms such as node and branch.
Sister Taxa: Learn what a sister taxon is and why recognizing them will help you with all of the following steps.
Cladogram Styles: Examples of the same cladogram drawn in different styles and orientation.
Rotate at a Node: Are the two cladograms identical, merely rotated at nodes, or are they different topologies?
Polytomies: Are they "hard" or "soft" and how do they relate to strict consensus estimates?
To print out the lab for completion or for later reference:
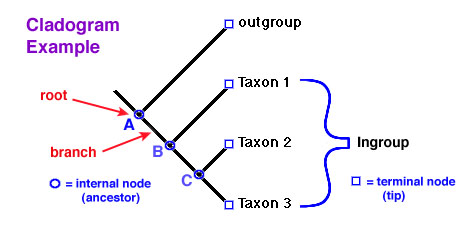
Each internal node is also at the base of a clade, which includes the common ancestral population (node) plus all its descendents. For example, the clade that includes both Taxon 2 and Taxon 3 is hypothesized, in this cladogram, to include their shared ancestor (actually, an interbreeding population of organisms) at internal node C and everything it gave rise to (in this case, Taxon 2 and Taxon 3). Likewise, the clade that includes all four terminal nodes and their most recently shared common ancestor originates at node A and includes all its descendents (i.e., everything to the right of node A).
Node A is termed the root of the cladogram because it is at the base of the cladogram. As in this case, the root is normally drawn with a dangling branch extending earlier (to the left in this case) of the root to indicate that this clade also is part of other more inclusive clades of living organisms, originating from even earlier ancestral populations. Eventually, this dangling connection would lead clear back to the ancestor of all of life. You can think about this cladogram as the hypothesis of what branching events happened since the moment in time when the ancestral population at node A first speciated, that is, split from one into two (in this case) species. Later in time, there were further splits, resulting in new clades that are hierarchically nested within the original clade. In particular, the clade arising from the ancestral population at node B originated later than the one arising from the original ancestral population at node A. The clade arising from the ancestral population at node B is hierarchically nested within the clade arising from node A. To use an example, mammals are nested hierarchically within the clade of all vertebrate animals. The common ancestor of all vertebrates lived before the common ancestor for all mammals. There are vertebrates that are not mammals, but all mammals are vertebrates. Mammals are a particular subgroup or part of the whole vertebrate clade.
There are four terminal nodes in this example. These include members of the ingroup: Taxon 1, Taxon 2, and Taxon 3, and a single outgroup taxon. The clade arising from node B includes all three ingroup taxa. The purpose of a cladogram is to express a particular hypothesis for the relative branching order of the ingroup taxa. This cladogram example suggests that Taxon 2 and Taxon 3 more recently shared a common ancestor than either does with Taxon 1. While this hypothesis implies that the ancestral population at node B lived before the ancestral population at node C, it does not stipulate how much earlier it lived. In other words, the cladogram is only a hypothesis of the relative order of branching; it does not indicate how much absolute time past between branching events.
You should be able to find a clade originating from each internal node in this particular cladogram example.
A helpful way to think about which groupings of terminal nodes are clades, in a particular
cladogram, is the snip rule. Whenever you "snip" a branch directly beneath an internal node, a clade
falls off. The three such clades here are:
Taxon 2 + Taxon 3
Taxon 1 + (Taxon 2 + Taxon 3)
and Outgroup
+ (Taxon 1 + (Taxon 2 + Taxon 3)).
In contrast, a grouping of Taxon 1 and
Taxon 2 without Taxon 3 is not a clade, according to this cladogram hypothesis,
because there is no way to snip off the first two without Taxon 3 also falling off.
The use of parentheses above helped to more concisely indicate sister taxon associations within a clade.
This reflects an accepted standard to specify a cladogram hypothesis with nested parentheses.
Using this convention, the example cladogram can be unambiguously stated as:
(outgroup (Taxon 1 (Taxon 2, Taxon 3)))
Can you draw the following alternative cladogram hypotheses?:
(outgroup (Taxon 3 (Taxon 1, Taxon 2)))
(outgroup (Taxon 2 (Taxon 1, Taxon 3)))
|
|
| SUBMIT YOUR COMPLETED FORM BY THE DATE ANNOUNCED. |
Click
here to open new window with above cladogram example.
Feedback on particular questions that confused you are welcome!
Email feedback to deernisse at fullerton dot edu
Return to Biology 325 Home Page
This website development began on August 27, 2000 and was last modified on February 24, 2004.
![]() CSU Fullerton, Biological
Science Home Page
CSU Fullerton, Biological
Science Home Page